Jesús Lascorz1, Kari Hemminki2, Asta Försti2
1 Division of Molecular Genetic Epidemiology, German Cancer Research Center (DKFZ), Heidelberg, Germany
2 Division of Molecular Genetic Epidemiology, German Cancer Research Center (DKFZ), Heidelberg, Germany; Center for Primary Health Care Research, Clinical Research Center, Lund University, Malmö, Sweden
| Date of Submission | 14-Dec-2010 |
| Date of Acceptance | 22-Jan-2011 |
| Date of Web Publication | 24-Mar-2011 |
Correspondence Address:
Jesús Lascorz
Division of Molecular Genetic Epidemiology, German Cancer Research Center (DKFZ), Heidelberg, Germany
Source of Support: None, Conflict of Interest: None
DOI: 10.4103/1477-3163.78268
Abstract
Background: A large number of gene expression profiling (GEP) studies on colorectal carcinogenesis have been performed but no reliable gene signature has been identified so far due to the lack of reproducibility in the reported genes. There is growing evidence that functionally related genes, rather than individual genes, contribute to the etiology of complex traits. We used, as a novel approach, pathway enrichment tools to define functionally related genes that are consistently up- or down-regulated in colorectal carcinogenesis. Materials and Methods: We started the analysis with 242 unique annotated genes that had been reported by any of three recent meta-analyses covering GEP studies on genes differentially expressed in carcinoma vs normal mucosa. Most of these genes (218, 91.9%) had been reported in at least three GEP studies. These 242 genes were submitted to bioinformatic analysis using a total of nine tools to detect enrichment of Gene Ontology (GO) categories or Kyoto Encyclopedia of Genes and Genomes (KEGG) pathways. As a final consistency criterion the pathway categories had to be enriched by several tools to be taken into consideration. Results: Our pathway-based enrichment analysis identified the categories of ribosomal protein constituents, extracellular matrix receptor interaction, carbonic anhydrase isozymes, and a general category related to inflammation and cellular response as significantly and consistently overrepresented entities. Conclusions: We triaged the genes covered by the published GEP literature on colorectal carcinogenesis and subjected them to multiple enrichment tools in order to identify the consistently enriched gene categories. These turned out to have known functional relationships to cancer development and thus deserve further investigation.
Keywords: Carcinogenesis, colorectal cancer, enrichment analysis, gene expression profiling
How to cite this article:
Lascorz J, Hemminki K, Försti A. Systematic enrichment analysis of gene expression profiling studies identifies consensus pathways implicated in colorectal cancer development. J Carcinog 2011;10:7
How to cite this URL:
Lascorz J, Hemminki K, Försti A. Systematic enrichment analysis of gene expression profiling studies identifies consensus pathways implicated in colorectal cancer development. J Carcinog [serial online] 2011 [cited 2021 Oct 15];10:7. Available from: https://carcinogenesis.com/text.asp?2011/10/1/7/7826
Background
Colorectal cancer (CRC) is the third most common cancer, comprising 9.7% of all cancer cases, and is the fourth leading cause of cancer death worldwide, accounting for 8% of all cancer deaths. [1] Many gene expression profiling (GEP) studies on colorectal carcinogenesis have been performed in the last decade using microarray technology. However, comparative analysis of the differentially expressed genes reported by independent studies shows a relatively limited degree of overlap, and no reliable biomarker profile discriminating cancerous from normal tissue has been identified. The majority of the published GEP studies on colorectal carcinogenesis has already been subjected to meta-analyses that have aimed at establishing consistent signature profiles for tumor development. [2],[,3],[4] These meta-analyses have collected published lists of differentially expressed genes from the original GEP studies comparing CRC to normal tissue and then selected the genes reported in multiple studies. The genes reported only sporadically are thought to have resulted from inherent noise or biases in the different platforms and analysis methods employed. [5] The consistently reported genes are considered to be biologically relevant to CRC.
There is an increasing interest in searching for networks of genes, instead of single genes, contributing to the etiology of complex diseases, since changes in biological characteristics require coordinate variation in expression of gene sets. [6] Enrichment analysis tools, which estimate overrepresentation of particular gene categories or pathways in a gene list, are a useful approach in this direction.
Our goal was to define functional categories [Gene Ontology (GO) terms or Kyoto Encyclopedia of Genes and Genomes (KEGG) pathways] that are consistently overrepresented among differentially expressed genes inferred from the published GEP studies on colorectal carcinogenesis. We collected the list of genes from three published meta-analyses and used them as an input list for an overrepresentation analysis with several independent enrichment tools, which are based on diverse statistical and bioinformatic algorithms.[7] The strategy of applying multiple tools is recommended for the most satisfactory results. [8] The stringent selection criteria for the genes to be analyzed and the requirement for concordance between enrichment analysis results helped us to identify consistently enriched gene categories of likely relevance in colorectal carcinogenesis.
Materials and Methods
Gene expression profiling studies
We collected data from three meta-analyses, covering 34 GEP studies on the colorectal carcinogenesis process, published between the years 2001 and 2007. [2],[3],[4] Two of the meta-analyses reported a list of genes which had a consistent direction in gene expression change between carcinoma and normal mucosa in at least three single GEP studies, [2],[3] while the threshold was two GEP studies in the oldest meta-analysis [4] [Table 1].
| Table 1: Three meta-analyses of gene expression profiling studies on CRC carcinogenesis process Click here to view |
Gene list collection
For the meta-analysis by Sagynaliev et al. [4] we used Entrez Gene from NCBI (www.ncbi.nlm.nih.gov/gene/), and the Gene ID conversion tool from the DAVID bioinformatics resources [9] to convert the reported gene identifiers into the official HUGO gene symbol, which was used as the identifier for the reported genes. Next, the three gene lists from the three meta-analyses were combined, resulting in a list of 242 unique annotated genes [Table 2].
| Table 2: The list of 242 unique, annotated genes reported in the three meta-analyses of GEP studies on CRC carcinogenesis used for enrichment analyses Click here to view |
Enrichment analysis
We performed enrichment analyses using the databases GO (Biological Process and Molecular Function), [10] and KEGG pathways. [11] For all enrichment tools, the input gene set consisted of the same 242-gene list. The nine selected enrichment software tools differed in the statistical model applied for the enrichment analysis and in the method of correction for multiple testing [Table 3]. The tools were used with the default options: significance threshold of 0.05 for adjusted P value, at least two genes from the input list in the enriched category, and the whole genome as the reference background. For GATHER, the recommended ln(Bayes factor) >6 was used as the significance threshold.
| Table 3: Enrichment tools used and their characteristics Click here to view |
Consistently enriched categories
We considered only the GO or KEGG categories reported to be significantly enriched by several enrichment tools as consistently overrepresented in the 242-gene list. This strategy, based on testing multiple tools, is recommended in order to obtain the most satisfactory results. [8] We selected as a threshold the number of tools reporting at least four common enriched categories, so that only top-ranked categories were finally considered. This threshold was five enrichment tools for GO Biological Process, six enrichment tools for GO Molecular Function, and three enrichment tools for KEGG pathways [Table 4].
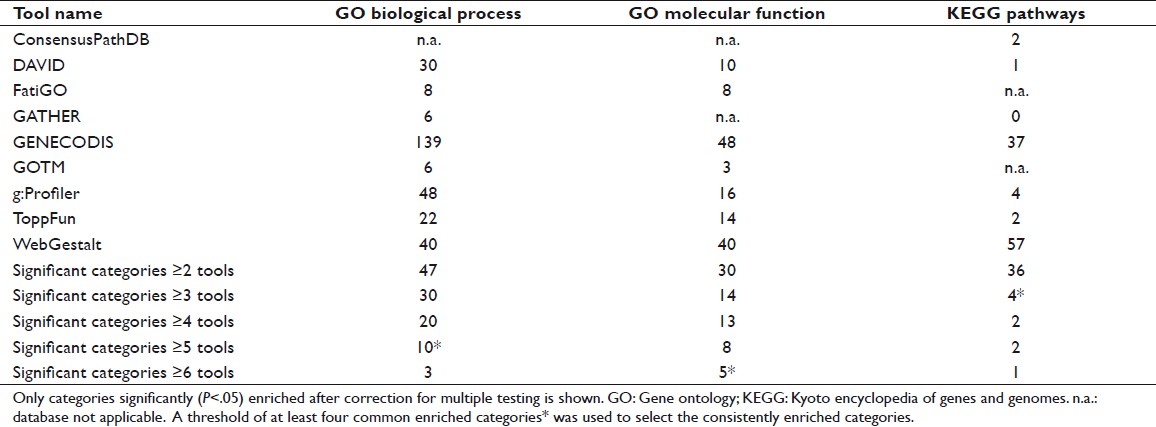 |
Table 4: Number of overrepresented GO and KEGG categories in the 242-gene list for each of the enrichment tools used Click here to view |
Results
Data collection and gene selection
A total of 242 unique mapped genes [Table 2] were reported in at least one of the three meta-analyses (65 of them in two and 26 in all three meta-analyses), 145 (59.9%) of the genes were up-regulated and 97 (40.1%) down-regulated in cancer vs normal tissue. Twenty-four of the 242 genes (9.9%) had been reported by two single GEP studies and 218 genes (90.1%) by at least three single GEP studies.
Enrichment analyses
Nine enrichment tools were used to obtain significantly overrepresented categories (GO Biological Process, GO Molecular Function, and KEGG pathways) [Table 5].
| Table 5: Click here to view |
Identification of consistently enriched categories
The number of reported enriched categories showed considerable variability with the different tools used [Table 4] even though the same significance threshold (P<.05 after correction for multiple testing) and analysis conditions (whole genome as the reference background and at least two genes from the input list in the enriched category) were applied. Differences were also observed in the number of genes in a particular category and the enrichment P values reported by each tool [Table 5]. To avoid false positives among the varying results, only the categories reported to be enriched by several tools (five enrichment tools for GO Biological Process, six for GO Molecular Function, and three for KEGG pathways) were considered to be consistently enriched. Using this selection criteria, ten general GO Biological Process categories (cell proliferation, inflammatory response, multicellular organismal metabolic process, regulation of cell proliferation, response to chemical stimulus, response to external stimulus, response to nutrient, response to stress, response to wounding, and translational elongation); five GO Molecular Function categories (carbonate dehydratase activity, cytokine activity, extracellular matrix binding, receptor binding, and structural constituent of ribosome); and four KEGG pathways (extracellular matrix receptor interaction, focal adhesion, nitrogen metabolism, and ribosome) were consistently overrepresented in the 242 gene list [Table 6]. The ratio of enrichment was higher for the more specific and well-defined KEGG pathways than for the broad GO categories [Figure 1]. A very high overlap of the individual genes among these categories was also observed [Table 7]. Based on this overlap, four biologically meaningful category groups were finally obtained:
- Seventeen common genes included in the GO Biological Process translational elongation, the GO Molecular Function structural constituent of ribosome, and the KEGG pathway ribosome.
- Genes in the two KEGG pathways extracellular matrix receptor interaction and focal adhesion that were also included in the broad categories of GO Molecular Function receptor binding and GO Biological Process response to external stimulus.
- The five genes included in both the GO Molecular Function category carbonate dehydratase activity and the KEGG pathway nitrogen metabolism.
- A large group of seven general GO Biological Process categories (inflammatory response, response to chemical stimulus, response to external stimulus, response to nutrient, response to stress, and response to wounding), together with two general GO Molecular Function categories (cytokine activity and receptor binding).
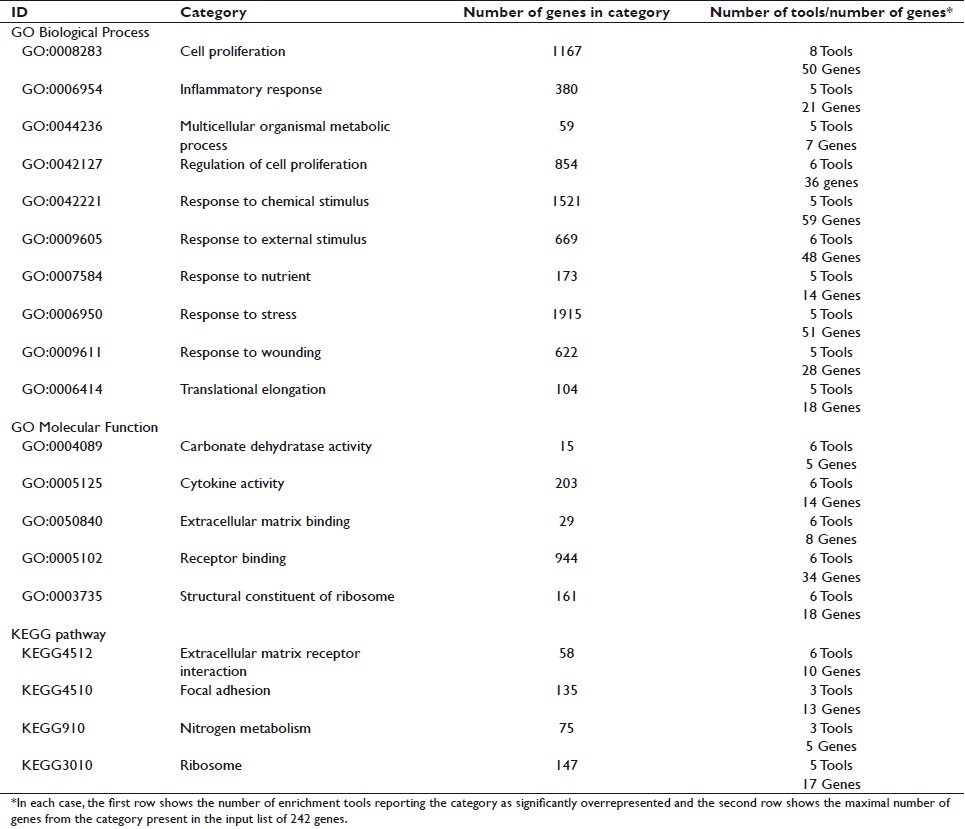 |
Table 6: Consistently enriched GO and KEGG categories Click here to view |
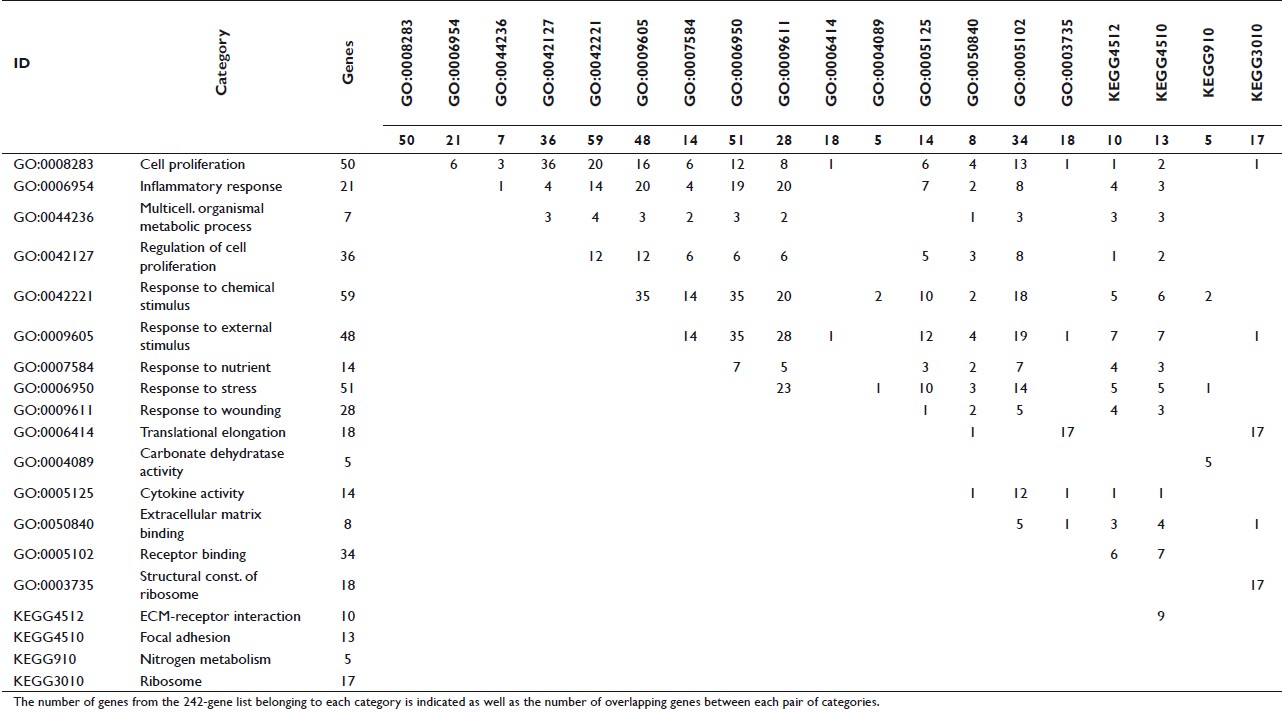 |
Table 7: Overlap of the genes from the consistently enriched GO and KEGG categories Click here to view |
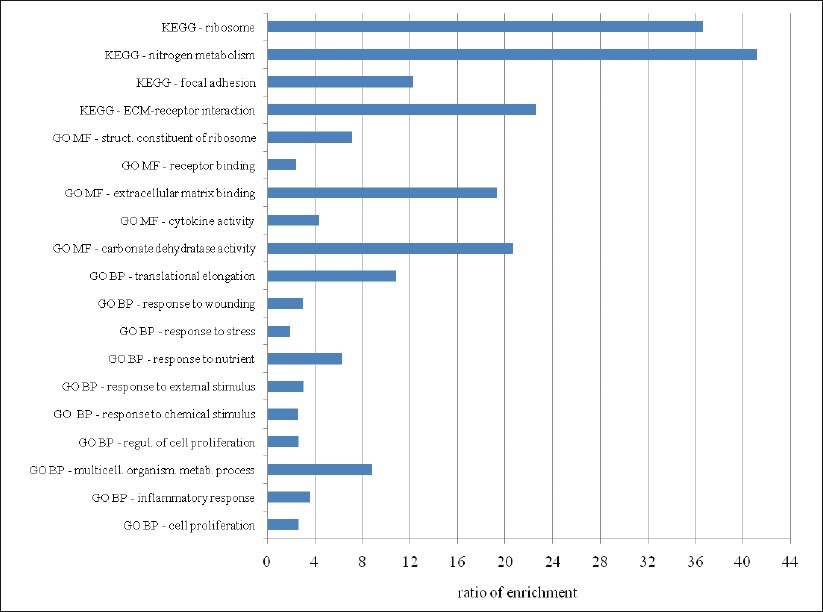 |
Figure 1: Bar chart of enrichment ratios for GO and KEGG categories in the 242-gene list. Ratio of enrichment = the number of observed genes divided by the number of expected genes from each GO or KEGG category in the 242-gene list (according to WebGestalt or, alternatively, DAVID or GOTM tools). GO BP: Gene Ontology Biological Process; GO MF: Gene Ontology Molecular Function; KEGG: Kyoto Encyclopedia of Genes and Genomes. Click here to view |
Discussion
The large number of microarray studies on colorectal carcinogenesis has shown a low degree of overlap in the identified genes. We extracted the 242 unique genes reported in three meta-analyses of GEP studies on colorectal carcinogenesis. [2],[3],[4] Only the meta-analysis by Cardoso et al. [2] includes a descriptive exploration of the main GO categories present among the differentially expressed genes. In an attempt to overcome the known lack of reproducibility at individual gene level among the GEP studies, we used up to nine bioinformatic enrichment tools to statistically determine which GO categories or KEGG pathways were significantly overrepresented in the 242-gene list. A total of 34 independent GEP studies were included in the three meta-analyses. Most of them used whole-genome expression arrays, which include probes for expression analysis of thousands of genes. Thus, we used all genes in the genome as background for the enrichment analysis. Although this might be an overestimation, the heterogeneity in the number of genes interrogated in every single one of the 34 GEP experiments does not allow application of a more appropriate restricted background. We believe that our rigorous strategy for the selection of enriched categories overcomes the forced probable overestimation of the reference background. After application of rigorous selection criteria, a total of 19 categories (15 GO terms and 4 KEGG pathways) were considered as consistently overrepresented. When considering the individual genes from each of these 19 categories, a very high degree of overlap among the categories was observed, reducing the number of categories with biological significance to four clearly different groups.
First, the same 17 ribosomal proteins (RPs) were present in the GO Biological Process translational elongation, the GO Molecular Function structural constituent of ribosome, and the KEGG pathway ribosome (RPL3, RPL6, RPL7, RPL8, RPL18A, RPL23, RPL29, RPL30, RPL31, RPLP2, RPSA, RPS2, RPS5, RPS7, RPS18, RPS19, and RPS23) [Figure 2]. All of them showed increased expression in tumor vs normal tissue. It is known that different expression patterns of RPs exist in CRC. Also, ribosomal biogenesis has clearly been linked to cancer [12] and several studies have pointed out two possible functions of RPs in colorectal carcinogenesis: perturbation of their function in protein biosynthesis and direct influence in tumorigenesis through extraribosomal functions (summarized in Lai et al. [13] ). Second, the KEGG terms extracellular matrix receptor interaction and focal adhesion shared nine genes (COL1A1, COL1A2, COL3A1, COL4A1, COL11A1, FN1, ITGA2, SPP1, and THBS2) [Figure 3]. Specific interactions of the extracellular matrix molecules control cellular activities such as adhesion, differentiation, apoptosis, and proliferation.[14] Third, the GO category carbonate dehydratase activity and the KEGG pathway nitrogen metabolism included the same five carbonic anhydrase (CA) isozymes (CA1, CA2, CA4, CA7, and CA12) [Figure 4]. All five mRNAs are down-regulated in CRC compared to normal tissue, as also shown in another study for CA2 and CA12. [15] Recent data have confirmed the functional contribution of CAs, especially CA9 and CA12, to hypoxic tumor growth and progression.[16] Inhibition of CA9, which is overexpressed in many tumor types in response to the hypoxia inducible factor (HIF) pathway, is being tested as anticancer therapeutic strategy.[17] Finally, a very general group of GO categories related to inflammation and cellular response included a large number of genes (between 14 and 59). Interestingly, this category included two genes that have been identified through genome-wide association studies as low-risk inherited genetic variants contributing to CRC risk. [18] These genes, the proto-oncogene MYC (8q24) and the bone morphogenetic protein gene BMP4 (14q22.2), were up-regulated in carcinoma tissue. Thus, judging by the functional class of the genes from the identified enriched categories, they look promising candidates for studies aimed at investigating their possible influence in CRC development.
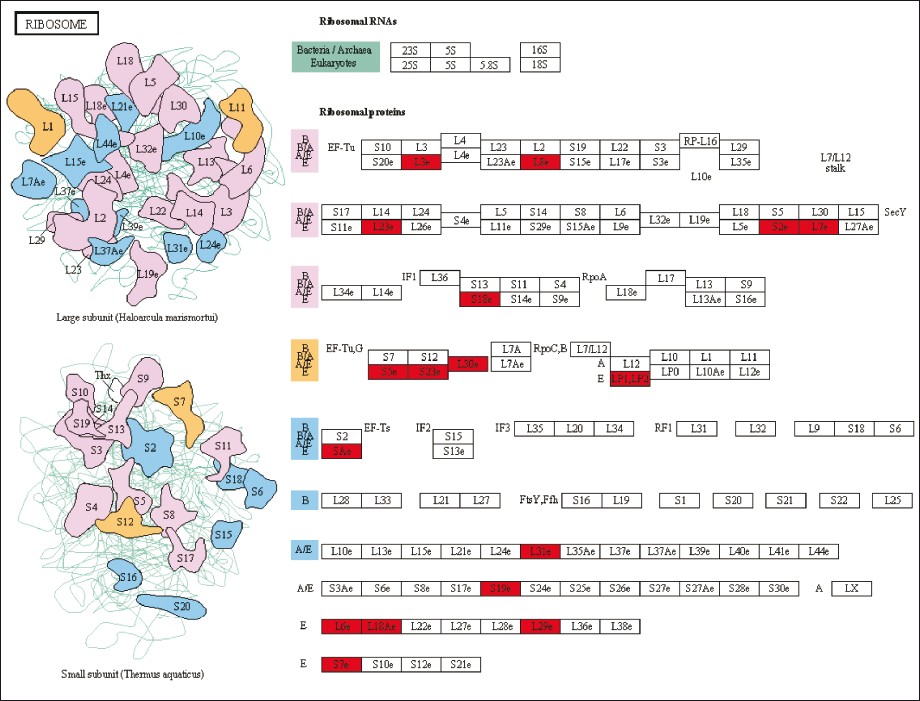 |
Figure 2: Representation of the KEGG ribosome category (map03010), with the 17 genes from the 242 gene list indicated in red Click here to view |
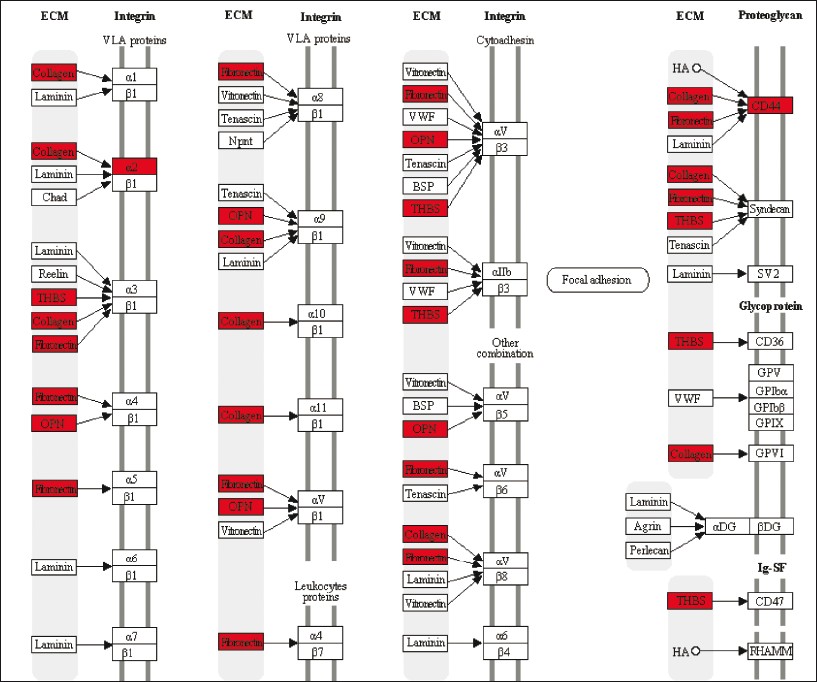 |
Figure 3: Representation of the KEGG extracellular matrix receptor interaction category (map04512), with location of the ten genes from the 242 gene list indicated in red. Click here to view |
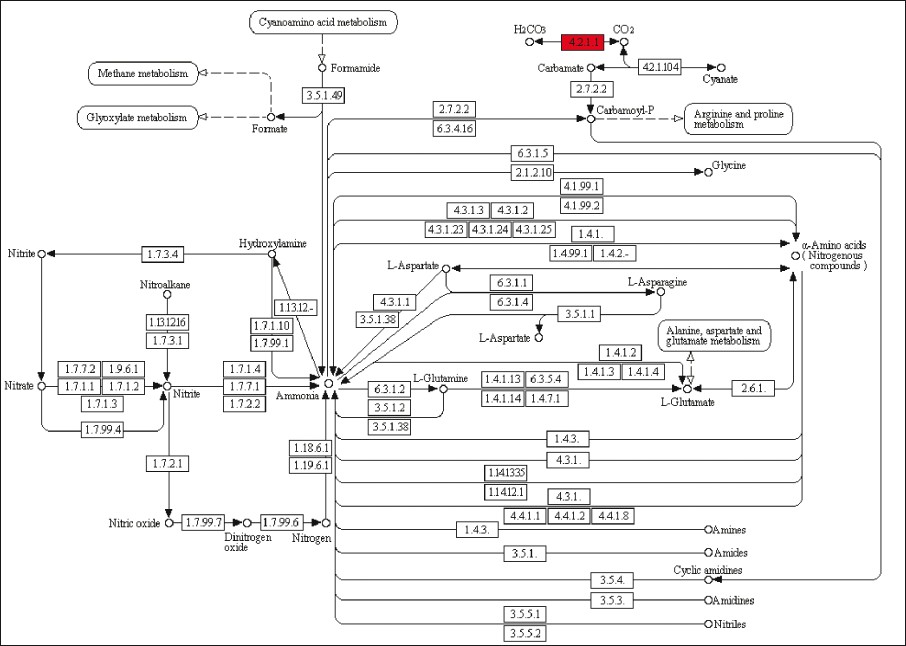 |
Figure 4: Representation of the KEGG nitrogen metabolism category (map00910), with location of the reaction catalyzed by the five carbonic anhydrase isozymes from the 242 gene list indicated in red Click here to view |
In general, we observed a considerable variation in the number of enriched categories reported by each tool although there was uniformity in the analysis conditions used. However, despite this apparent variation, most of the enriched categories reported by the more stringent tools (those reporting a small number of enriched categories) were ranked among the top-categories by the more generous tools (those reporting a larger number of enriched categories). We considered this result of special interest because of previously reported lack of reproducibility between different enrichment tools. [7],[8],[19] This variability has been attributed to the statistical models applied by the enrichment analysis, to the method of correction for multiple testing, and to differences in the versions of the GO and KEGG data sources used. Thus, our strategy of using several bioinformatic tools to extract biologically related genes consistently involved in colorectal carcinogenesis proved to be successful.
Conclusions
We used the list of 242 unique mapped genes from three meta-analyses of GEP studies on colorectal carcinogenesis for a systematic enrichment analysis of GO categories and KEGG pathways, applying up to nine different enrichment tools. After applying stringent selection criteria to avoid false positive results, the ribosomal proteins group, the extracellular matrix receptor interaction category, the carbonic anhydrase isozymes, and a general category related to inflammation emerged as significantly and consistently overrepresented categories. These categories have known functional relationships to CRC development and their value as diagnostic markers and therapeutic targets deserve further investigation.[27]
Competing interests
The authors declare that they have no competing interests.
Authors’ contributions
JL and AF conceived and designed the study. JL conducted the analyses and wrote the initial manuscript. KH provided oversight and conceptual guidance to the project. KH and AF contributed to the final manuscript. All authors read and approved the final manuscript.
Funding
German National Genome Research Network (NGFN-Plus); the Deutsche Krebshilfe (German Cancer AID); and European Union (EU) (HEALTH-F4-2007-200767).
References
| 1. | Ferlay J, Shin HR, Bray F, Forman D, Mathers C, Parkin DM. Estimates of worldwide burden of cancer in 2008: GLOBOCAN 2008. Int J Cancer 2010 in press.  |
| 2. | Cardoso J, Boer J, Morreau H, Fodde R. Expression and genomic profiling of colorectal cancer. Biochim Biophys Acta 2007;1775:103-37. [PUBMED] [FULLTEXT] |
| 3. | Chan SK, Griffith OL, Tai IT, Jones SJ. Meta-analysis of colorectal cancer gene expression profiling studies identifies consistently reported candidate biomarkers. Cancer Epidemiol Biomarkers Prev 2008;17:543-52. [PUBMED] [FULLTEXT] |
| 4. | Sagynaliev E, Steinert R, Nestler G, Lippert H, Knoch M, Reymond MA. Web-based data warehouse on gene expression in human colorectal cancer. Proteomics 2005;5:3066-78. [PUBMED] [FULLTEXT] |
| 5. | Siddiqui AS, Delaney AD, Schnerch A, Griffith OL, Jones SJ, Marra MA. Sequence biases in large scale gene expression profiling data. Nucleic Acids Res 2006;34:e83. [PUBMED] [FULLTEXT] |
| 6. | Hardy J, Singleton A. Genomewide association studies and human disease. N Engl J Med 2009;360:1759-68. [PUBMED] [FULLTEXT] |
| 7. | Huang da W, Sherman BT, Lempicki RA. Bioinformatics enrichment tools: Paths toward the comprehensive functional analysis of large gene lists. Nucleic Acids Res 2009;37:1-13. [PUBMED] [FULLTEXT] |
| 8. | Rhee SY, Wood V, Dolinski K, Draghici S. Use and misuse of the gene ontology annotations. Nat Rev Genet 2008;9:509-15. [PUBMED] [FULLTEXT] |
| 9. | Huang da W, Sherman BT, Lempicki RA. Systematic and integrative analysis of large gene lists using DAVID bioinformatics resources. Nat Protoc 2009;4:44-57. [PUBMED] [FULLTEXT] |
| 10. | Ashburner M, Ball CA, Blake JA, Botstein D, Butler H, Cherry JM, et al. Gene ontology: Tool for the unification of biology: The Gene Ontology Consortium. Nat Genet 2000;25:25-9. [PUBMED] [FULLTEXT] |
| 11. | Kanehisa M, Goto S, Kawashima S, Okuno Y, Hattori M. The KEGG resource for deciphering the genome. Nucleic Acids Res 2004;32(Database issue):D277-80. |
| 12. | Lempiainen H, Shore D. Growth control and ribosome biogenesis. Curr Opin Cell Biol 2009;21:855-63. |
| 13. | Lai MD, Xu J. Ribosomal proteins and colorectal cancer. Curr Genomics 2007;8:43-9. [PUBMED] [FULLTEXT] |
| 14. | Desgrosellier JS, Cheresh DA. Integrins in cancer: Biological implications and therapeutic opportunities. Nat Rev Cancer 2010;10:9-22. [PUBMED] [FULLTEXT] |
| 15. | Niemela AM, Hynninen P, Mecklin JP, Kuopio T, Kokko A, Aaltonen L, et al. Carbonic anhydrase IX is highly expressed in hereditary nonpolyposis colorectal cancer. Cancer Epidemiol Biomarkers Prev 2007;16:1760-6. |
| 16. | Guler OO, De Simone G, Supuran CT. Drug design studies of the novel antitumor targets carbonic anhydrase IX and XII. Curr Med Chem 2010;17:1516-26. [PUBMED] [FULLTEXT] |
| 17. | Poulsen SA. Carbonic anhydrase inhibition as a cancer therapy: A review of patent literature, 2007 – 2009. Expert Opin Ther Pat 2010;20:795-806. [PUBMED] [FULLTEXT] |
| 18. | Tenesa A, Dunlop MG. New insights into the aetiology of colorectal cancer from genome-wide association studies. Nat Rev Genet 2009;10:353-8. [PUBMED] [FULLTEXT] |
| 19. | Khatri P, Draghici S. Ontological analysis of gene expression data: Current tools, limitations, and open problems. Bioinformatics 2005;21:3587-95. |
| 20. | Kamburov A, Wierling C, Lehrach H, Herwig R. ConsensusPathDB–a database for integrating human functional interaction networks. Nucleic Acids Res 2009;37(Database issue):D623-8. |
| 21. | Al-Shahrour F, Diaz-Uriarte R, Dopazo J. FatiGO: A web tool for finding significant associations of Gene Ontology terms with groups of genes. Bioinformatics 2004;20:578-80. |
| 22. | Chang JT, Nevins JR. GATHER: A systems approach to interpreting genomic signatures. Bioinformatics 2006;22:2926-33. [PUBMED] [FULLTEXT] |
| 23. | Carmona-Saez P, Chagoyen M, Tirado F, Carazo JM, Pascual-Montano A. GENECODIS: A web-based tool for finding significant concurrent annotations in gene lists. Genome Biol 2007;8:R3. [PUBMED] [FULLTEXT] |
| 24. | Zhang B, Schmoyer D, Kirov S, Snoddy J. GOTree Machine (GOTM): A web-based platform for interpreting sets of interesting genes using Gene Ontology hierarchies. BMC Bioinformatics 2004;5:16. [PUBMED] [FULLTEXT] |
| 25. | Reimand J, Kull M, Peterson H, Hansen J, Vilo J. g:Profiler–a web-based toolset for functional profiling of gene lists from large-scale experiments. Nucleic Acids Res 2007;35:W193-200. [PUBMED] [FULLTEXT] |
| 26. | Chen J, Bardes EE, Aronow BJ, Jegga AG. ToppGene Suite for gene list enrichment analysis and candidate gene prioritization. Nucleic Acids Res 2009;37:W305-11. [PUBMED] [FULLTEXT] |
| 27. | Zhang B, Kirov S, Snoddy J. WebGestalt: An integrated system for exploring gene sets in various biological contexts. Nucleic Acids Res 2005;33:W741-8. [PUBMED] [FULLTEXT] |
Authors
Prof. Kari Hemminki, 1973 PhD in Medicine, University of Helsinki, Finland 1973 MD in Medicine, University of Helsinki, Finland 1975 Docent in Biochemistry, University of Helsinki, Finland 1976 – 1978 Postdoc in Molecular Biology, John Hopkins, Baltimore, USA
Jesus Lascorz, 2001 BsC in Biochemistry, University of Zaragoza, Spain 2002 – 2003 Molecular Genetics Laboratory, Central Institute of Mental Health, University of Heidelberg, Mannheim, Germany 2008 PhD in Human Biology, Institute of Human Genetics, University Erlangen-Nόrnberg, Germany
Asta Foersti, 1984 M.Sc. in Biochemistry, University of Kuopio, Finland 1992 PhD in Biochemistry and Biotechnology, University of Kuopio, Finland
Figures
[Figure 1], [Figure 2], [Figure 3], [Figure 4]
Tables
[Table 1], [Table 2], [Table 3], [Table 4], [Table 5], [Table 6], [Table 7]