Casey Scott Duckwall1, Taylor Athanasaw Murphy1, Jamey Dale Young2
1 Department of Chemical and Biomolecular Engineering, PMB 351604, 2301 Vanderbilt Place, Vanderbilt University, Nashville, TN 37235-1604, USA
2 Departments of Chemical, Biomolecular Engineering, Molecular Physiology and Biophysics, PMB 351604, 2301 Vanderbilt Place, Vanderbilt University, Nashville, TN 37235 1604, USA
| Date of Submission | 15-Feb-2013 |
| Date of Acceptance | 12-May-2013 |
| Date of Web Publication | 24-Jul-2013 |
Correspondence Address:
Jamey Dale Young
Departments of Chemical, Biomolecular Engineering, Molecular Physiology and Biophysics, PMB 351604, 2301 Vanderbilt Place, Vanderbilt University, Nashville, TN 37235 1604
USA
Source of Support: None, Conflict of Interest: None
DOI: 10.4103/1477-3163.115422
Abstract
The reprogramming of energy metabolism is emerging as an important molecular hallmark of cancer cells. Recent discoveries linking specific metabolic alterations to cancer development have strengthened the idea that altered metabolism is more than a side effect of malignant transformation, but may in fact be a functional driver of tumor growth and progression in some cancers. As a result, dysregulated metabolic pathways have become attractive targets for cancer therapeutics. This review highlights the application of 13 C metabolic flux analysis (MFA) to map the flow of carbon through intracellular biochemical pathways of cancer cells. We summarize several recent applications of MFA that have identified novel biosynthetic pathways involved in cancer cell proliferation and shed light on the role of specific oncogenes in regulating these pathways. Through such studies, it has become apparent that the metabolic phenotypes of cancer cells are not as homogeneous as once thought, but instead depend strongly on the molecular alterations and environmental factors at play in each case.
Keywords: Aerobic glycolysis, isotopomer analysis, metabolomics, reductive carboxylation, warburg effect
How to cite this article:
Duckwall CS, Murphy TA, Young JD. Mapping cancer cell metabolism with 13 C flux analysis: Recent progress and future challenges. J Carcinog 2013;12:13
How to cite this URL:
Duckwall CS, Murphy TA, Young JD. Mapping cancer cell metabolism with 13 C flux analysis: Recent progress and future challenges. J Carcinog [serial online] 2013 [cited 2021 Oct 13];12:13. Available from: https://carcinogenesis.com/text.asp?2013/12/1/13/115422
Introduction
Altered metabolism inherent to cancer cells has been known since the 1924 publication of Otto Warburg’s seminal report on aerobic glycolysis in rat carcinoma cells. [1] He found these cells to exhibit dramatically elevated rates of glucose uptake and lactate production in spite of abundant oxygen – a phenotype that is normally exhibited only by hypoxic cells. This phenomenon, dubbed the “Warburg effect”, has been observed in multiple tumor types over the subsequent decades and is the basis for clinical 18 F-2-deoxyglucose positron emission tomography imaging of patient tumors. [2] Recent studies linking inhibition of aerobic glycolysis with reduced tumorigenicity and increased sensitivity to chemotherapeutics has renewed interests in Warburg’s original findings. [3],[4],[5] These results have also paved the way for broader studies implicating elevated glutamine metabolism [6] and glycine and serine biosynthesis [7],[8],[9] in cancer progression, as well as recurrent somatic mutations in mitochondrial enzymes such as isocitrate dehydrogenase (IDH), [10],[11] fumarase, [12] and succinate dehydrogenase [13] that are associated with specific cancer subtypes. Furthermore, a growing number of oncogenes have been shown to profoundly regulate metabolic activity, solidifying altered cell metabolism as a hallmark trait of cancer. [14]
Despite its central importance to cancer development, the inherently dynamic nature of cellular metabolism presents unique challenges for its quantification. Traditional procedures employed in cell biology focus on measuring transcript, enzyme and metabolite concentrations. While these data are useful for distinguishing healthy versus diseased states, they do not provide functional information about metabolic pathway activation and nutrient utilization. Rate-controlling metabolic enzymes are often regulated at multiple levels – transcriptionally, translationally, post-translationally and allosterically – emphasizing that mRNA or protein abundance does not equate with pathway activity. The functional end-point of this regulation is the metabolic flux, the kinetic rate of material flow through a biochemical pathway. It is therefore clear that static metabolite profiling alone will not describe the complete metabolic phenotype of a cell and that quantitative flux maps provide a unifying framework for unambiguous interpretation of other types of “omics” data. [15] Although targeted assays exist for quantification of specific metabolic reactions, they are typically limited in scope and would require the investment of substantial time and effort to characterize a large biochemical network. As a result, there is a clear need for a widely-available, systems-level, dynamic tool for quantitative studies of cellular metabolism. 13 C metabolic flux analysis (MFA) provides such a tool, which can be used to map the flow of carbon through entire biochemical networks, rather than individual reactions or nodes in isolation.
MFA studies are carried out by feeding cells an isotopically labeled substrate (e.g., 13 C-labeled glucose or glutamine) and subsequently measuring the patterns of isotope incorporation that emerge in downstream metabolites using mass spectrometry (MS) or nuclear magnetic resonance. For example, metabolites generated by multiple convergent pathways may yield different mass shifts that influence the mass isotopomer distributions (MIDs) of end products detectable by MS analysis. Simple reaction pathways can be readily deconvoluted using linear algebra to evaluate the contribution of each pathway toward the observed metabolite labeling patterns [Figure 1]a. Networks containing reversible, branching, or cyclic pathways generate complex labeling patterns that require computational modeling for accurate interpretation [Figure 1]b. These more sophisticated MFA studies use a predefined network to determine fluxes by integrating multiple isotopomer measurements with information on cellular growth rate, biomass composition and extracellular uptake and secretion rates. By systematically accounting for all extracellular carbon inputs and outputs and all major intracellular pathways, MFA can be used to reconstruct comprehensive flux maps that depict the flow of carbon throughout cellular metabolism. Comparison of flux maps obtained under varying experimental conditions or in the presence of targeted genetic manipulations provides a functional readout on the global impact these perturbations have on cell metabolism. Such information is essential to understanding how metabolic pathways are regulated in working cells and how they become dysregulated in diseased cells [Figure 2]. Over the past decade, progressive improvements to MFA methodology have made it more powerful and accessible to a wider range of researchers (reviewed in [16],[17],[18],[19],[20],[21] ), including those in the cancer biology community.
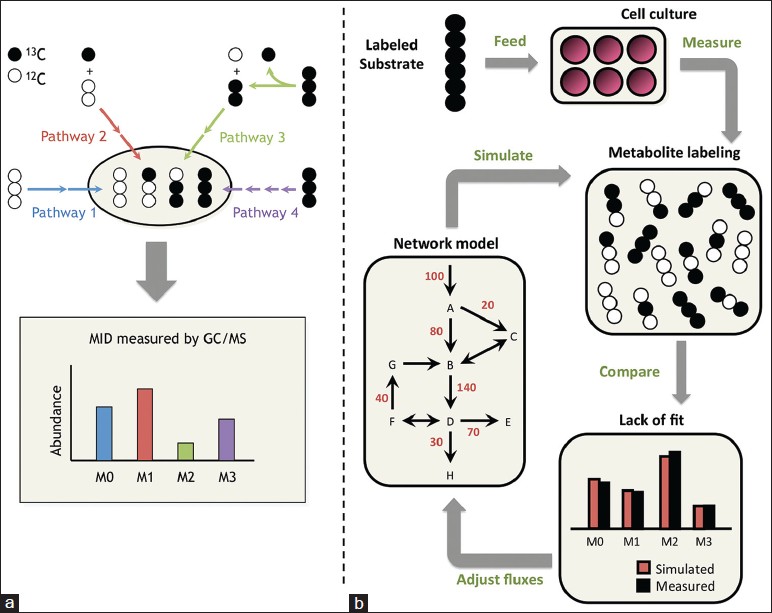 |
Figure 1: Isotope tracing and 13C-metabolic flux analysis. (a) In simple metabolic networks, each pathway produces a unique labeling pattern in the final product, and the resulting mass isotopomer distribution provides a direct measure of relative flux in the network. Mass isotopomers are molecules with the same chemical formula but different molecular weights due to varying incorporation of heavy isotopes. They are denoted M0, M1, M2, etc., in order of increasing weight. (b) In complex networks, a computational model is applied to determine fluxes by minimizing the lack of fit between simulated and measured labeling patterns at multiple pathway nodes. The flux parameters in the model are iteratively adjusted until the optimization converges Click here to view |
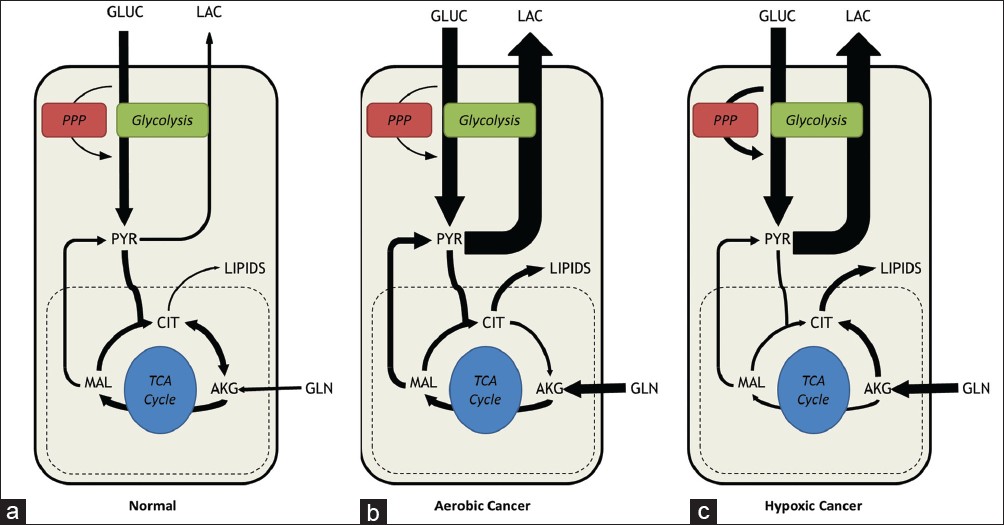 |
Figure 2: Metabolic phenotypes of normal versus cancer cells. (a) In normal cells under aerobic conditions, the majority of glucose consumed is fully oxidized in the tricarboxylic acid cycle to generate CO2 and to supply adenosine triphosphate (ATP). Lactate secretion and amino acid catabolism are minimal. (b) In cancerous cells, metabolism is rewired depending on oncogenic activation and environmental factors. Cancer cells increase their glycolytic flux by as much as 10-fold relative to normal cells. However, cancer cells grown in abundant oxygen and nutrients will typically maintain active mitochondrial respiration, fueled largely by elevated glutamine consumption. (c) In vivo tumors are subjected to varying oxygen tensions. In hypoxic environments, tumor cells adapt their energetic metabolism to generate ATP exclusively from glycolysis. However, mitochondria still provide key biosynthetic intermediates such as citrate for lipid synthesis. Glutamine metabolism may be redirected into reductive carboxylation to supply anaplerotic carbon directly to the citrate pool. One key point is that extracellular nutrient uptake and product secretion rates may not appear substantially different between panels (b and c), but isotope tracers and metabolic flux analysis enable detection of flux rerouting through intracellular metabolic pathways even in cases where extracellular rates are unchanged Click here to view |
Recent Applications of MFA to Cancer
Identification of novel biosynthetic pathways involved in cell proliferation
In order to proliferate, cancer cells require a pool of available sugar, amino acid and fatty acid substrates to synthesize the DNA, RNA, protein and lipid macromolecules necessary to produce a daughter cell. To maintain these substrate pools, cancer cells increase extracellular nutrient consumption and reroute metabolic processes to favor de novo biosynthesis [Figure 2]. A key goal of research in cancer cell metabolism is the identification of altered pathways that may be therapeutically targeted to slow or halt growth or initiate death in cancer cells but not in healthy cells. Furthermore, byproducts or intermediates formed in these pathways may provide novel biomarkers for cancer diagnosis, prognosis, or assessment of drug response. To these ends, researchers have begun applying MFA to investigate how energetic and biosynthetic pathways become rewired as a result of oncogenic transformation.
Tumor cells reroute glycolytic carbon into biosynthetic processes by limiting its entry into the tricarboxylic acid (TCA) cycle via two distinct mechanisms [Figure 3]. First, pyruvate dehydrogenase kinases (PDKs), a family of enzymes commonly upregulated in multiple tumor types, [22],[23] phosphorylate the active site of the pyruvate dehydrogenase (PDH) complex, effectively preventing it from catalyzing the acetylation of coenzyme A. using pyruvate as its substrate. Secondly, alternative splicing of the enzyme pyruvate kinase (PK) to its M2 isoform has been observed in multiple tumor types. [24],[25],[26] PKM2 commonly occurs in a low-activity, dimeric state, resulting in reduced flux from phosphoenolpyruvate to pyruvate. Both of these alterations have been shown to result in the accumulation of upstream glycolytic intermediates, which may be diverted toward de novo synthesis of macromolecular building blocks. [27] One recent study applied MFA and MID analyses to compare attached versus detached MCF-10A mammary epithelial cells and identified differential PK activity as a key metabolic branch point. [28] Extracellular matrix detachment resulted in decreased flux through all major central metabolic pathways (glycolysis, pentose phosphate pathway (PPP) and TCA cycle), but there was a disproportionate decrease in PDH flux. However, in the presence of HER2 overexpression, the PDH flux was maintained through suppression of PDK4 in an Erk-dependent manner.
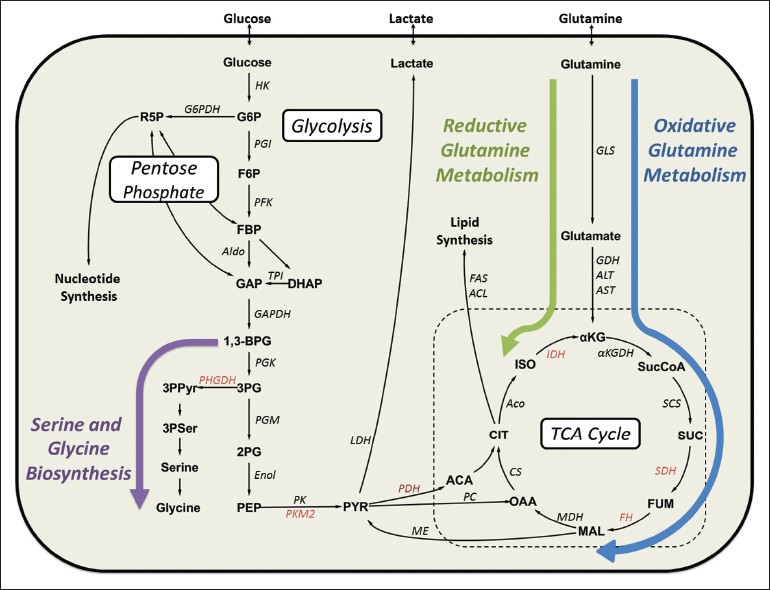 |
Figure 3: Major pathways of central carbon metabolism and key enzymes commonly dysregulated in cancer cells. Important pathways implicated in cancer cell proliferation are indicated: Serine metabolism is highlighted with a purple arrow, oxidative glutamine metabolism with a blue arrow and reductive glutamine metabolism with a green arrow. Enzymes known to be dysregulated in some cancers are shown in red text. Abbreviations: ACL = ATP citrate lyase, Aco = Aconitase, α KGDH=α -ketoglutarate dehydrogenase, Aldo = Aldolase, ALT = Alanine transaminase, AST = Aspartate transaminase, CS = Citrate synthase, Enol = Enolase, FAS = Fatty acid synthase, FH = Fumarate hydratase, G6PDH = Glucose-6-phosphate dehydrogenase, GAPDH = Glyceraldehyde-3-phosphate dehydrogenase, GDH = Glutamate dehydrogenase, GLS = Glutaminase, HK = Hexokinase, IDH = Isocitrate dehydrogenase, LDH = Lactate dehydrogenase, MDH = Malate dehydrogenase, ME = Malic enzyme, PC = Pyruvate carboxylase, PDH = Pyruvate dehydrogenase, PFK = Phosphofructokinase, PGI = Phosphoglucose isomerase, PGK = Phosphoglycerate kinase, PGM = Phosphoglycerate mutase, PHGDH = Phosphoglycerate dehydrogenase, PK = Pyruvate kinase, PKM2 = Pyruvate kinase M2, SCS = Succinyl-CoA synthetase, SDH = Succinate dehydrogenase, TPI = Triose phosphate isomerase Click here to view |
Despite the influence of PKM2 and PDKs on restricting the flow of glucose-derived carbon out of glycolysis and into mitochondrial pathways, many cancers exhibit high TCA cycle activity fueled at least partially by enhanced glutamine metabolism. [29] Glutamine is an important substrate to all cells playing key roles in protein synthesis, redox balancing, nucleotide synthesis and energy production. Application of MFA and MID analysis to understand the role of glutamine metabolism in cancer cells has revealed several new insights. SF188 glioblastoma cells grown under normoxia were shown to consume glutamine in excess of the requirement for nucleotide and protein synthesis. [30] Under these conditions, MID analysis revealed that SF188 cells rely largely on glutamine oxidation to fuel adenosine triphosphate (ATP) production, while glucose serves as the primary source of lipogenic carbon. In contrast, MFA studies in A549 lung carcinoma cells grown under hypoxia revealed that carbon derived from glutamine supplied the major source for de novo fatty acid synthesis. [31],[32] Interestingly, MFA and MID analysis revealed a novel, Hif-mediated metabolic process in both A549 and SF188 cell lines: the reductive carboxylation of α-ketoglutarate by IDH operating in the reverse direction [Figure 3]. This finding has been further confirmed in a panel of melanoma cell lines. [33] Ongoing research seeks to identify which particular IDH isoforms are capable of catalyzing reductive carboxylation in response to hypoxia or specific mitochondrial defects and which other reactions supply the reducing power necessary to drive this process. [32],[34]
Besides glutamine, the metabolism of other amino acids has been shown to also play a key role in cancer cell proliferation. Recent reports indicate a role for phosphoglycerate dehydrogenase (PHGDH) in the development of some cancers. [35],[36] PHGDH catalyzes the first step of serine biosynthesis from the glycolytic intermediate 3-phosphoglycerate [Figure 3]. In addition to its role as a protein building block, serine can be metabolized to glycine, which itself can be further metabolized by the glycine cleavage system to donate C1 groups to the folate pool. Both glycine and folate are involved in de novo nucleotide biosynthesis. PHGDH is located in a region of chromosome 1 that exhibits recurrent copy number amplification in breast cancer, [7] and melanoma cells with PHGDH gene amplification have been shown to become dependent on elevated PHGDH expression to maintain proliferation. [8] Additionally, induction of PHGDH in MCF-10A cells grown in matrigel resulted in the development of a highly invasive phenotype. MID analysis of cells with induced PHGDH expression revealed that elevated functional activity of the enzyme was required for transformed growth. Isotope tracing using [1- 13 C] glycine and [2- 13 C] glycine in human melanoma cells demonstrated that glycine was directly incorporated in the purine backbone and did not participate in further oxidation by the glycine cleavage system. [9]
Understanding the role of oncogenic signaling in regulating metabolic pathways
In addition to identifying novel pathways of flux rerouting in cancer cell lines, MFA has also been used to map global metabolic alterations associated with activation of specific oncogenes. K-Ras is commonly mutated at glycine residue 12 resulting in impaired GTPase activity and hyperactive signaling. [37] Expression of G12-mutated K-Ras in NIH3T3 murine fibroblasts results in oncogenic transformation, [38] and has been reported to facilitate the decoupling of glycolytic and TCA cycle metabolism. [39] Consistent with these results, MFA studies of NIH3T3 cells showed that oncogenic K-Ras decreased flux through PDH, diverting most glucose-derived carbon to lactate. [40] Interestingly, K-Ras transformation did not result in elevated glutamine consumption in NIH3T3 cells; however, a greater fraction of the incoming glutamine was used for anabolic synthesis. As a result, TCA cycle flux was globally downregulated as a result of reduced entry of carbon substrates. In addition to using 13 C-labeled tracers to map the flow of carbon, the authors used non-targeted tracer fate detection (NTFD) to determine how labeling from 15 N-glutamine propagated throughout the cell. NTFD analysis revealed that K-Ras transformation resulted in increased incorporation of glutamine-derived nitrogen into biosynthetic building blocks including various amino acids and even nucleotides. Additionally, a recent MID analysis using both human and murine pancreatic ductal adenocarcinoma (PDAC) cells carrying oncogenic K-Ras revealed a non-canonical pathway of glutamine utilization. K-Ras transformed PDAC cells relied on a cytosolic, glutamate-oxaloacetate transaminase 1 (GOT1) to convert glutamine-derived aspartate into cytosolic oxaloacetate. This oxaloacetate was subsequently converted into pyruvate via cytosolic malic enzyme in order to generate NADPH, which was shown to enhance growth of PDAC cells through maintenance of cellular redox balance. The implications of this transition to a GOT1-dependent glutamine metabolism are still being investigated. [41]
In contrast to the K-Ras-induced decoupling of glycolytic and oxidative metabolism, Myc-induced transformation appears to result in an opposing phenotype. Although Myc has been previously shown to enhance glucose metabolism in tumor cells, Murphy et al. [42] revealed that ectopic Myc expression in P493-6 B-cells actually had a more pronounced impact on amino acid metabolism than glucose metabolism. They also showed that most mitochondrial fluxes increased by 3-4 fold in response to Myc overexpression, whereas glycolysis was only marginally impacted. Parallel studies by Le et al. [43] using these same cells have shown that they can grow in the total absence of glucose by relying on complete oxidation of glutamine to generate ATP. These unexpected findings point toward new regulatory functions of the Myc oncogene, which will need to be tested in more complex tumor models. Because Murphy et al. [42] applied an MFA approach that relied exclusively upon isotopic measurements from stable protein and RNA pools, it is conceivable that their approach could be extended to 3D culture or in vivo systems that are not amenable to rapid extraction and isotopic analysis of labile intracellular metabolites.
The first study that applied comprehensive MFA to map cancer cell metabolism was published in 2006 by researchers investigating estrogen receptor (ER)-positive, breast carcinoma cells. [44] The response of MCF-7 cells to estradiol stimulation and two metabolic inhibitors – cerulinin, a fatty acid synthase inhibitor and oxamate, an inhibitor of lactate dehydrogenase – was characterized using MFA. The goal of this study was the identification of targets whose inhibition could be useful as adjuvant treatment in ER-antagonist therapies. The authors report elevated rates of glucose and glutamine consumption upon estradiol-stimulation. Surprisingly, however, they also report a dramatically elevated flux into the PPP. It was hypothesized that the NADPH generated by this pathway was critical for the elevated fatty acid synthesis required for proliferation; however, suppression of fatty acid synthesis via treatment with cerulinin did not reduce PPP flux.
Future Directions and Challenges
As experimental protocols [20],[31] and software tools [45],[46],[47],[48] for MFA continue to be standardized, refined and disseminated, applications to cancer biology and indeed systems biology as a whole will become increasingly more routine. However, studies of cultured tumor cells do not fully recapitulate the in vivo environment these cells experience inside a host tissue. Therefore, the next major leap toward establishing MFA as an indispensable tool for cancer research is its adaptation to systems that mimic in vivo patient tumors. [49] In this vein, Yuneva et al. [50] recently examined the differences between Met–and Myc-induced tumors in mouse livers. By using 13 C-glucose and 13 C-glutamine MID analysis, they found that Myc-driven tumors increased rates of glucose and glutamine catabolism while Met tumors actually produced glutamine from glucose. Akin to this study, Marin-Valencia et al. [51] applied MID analysis to study the effects of plasma infusions of 13 C-glucose on mice bearing human glioblastoma orthotopic tumors. They found that all tumors studied exhibited active mitochondrial glucose oxidation as well as conversion of glucose carbon into glutamine and other biosynthetic intermediates.
The transition of MFA from 2D cell cultures to 3D cultures to in vivo models is complicated by a host of factors. The shear amount of labeled substrate required for adequate tracer incorporation in intracellular metabolites can be cost-prohibitive for longer-term in vivo labeling studies. However, the largest hurdle from a methodology perspective arises from the mixed cell populations inherent to in vivo studies. Determining extracellular exchange rates solely for the tumor cells in a mixed cell population is also problematic. Without absolute values for the extracellular exchange rates, MFA flux estimations are unconstrained, allowing the calculation only of relative flux ratios. Another consideration is the acquisition of adequate sample sizes. Current sample analysis techniques were developed using 2D cell culture models, which allow for the collection of large samples that may be unrealistic for some in vivo or 3D culture systems. However, advances in extracting labeling data from cell macromolecules decreases the sample size needed, making in vivo MFA potentially feasible. Ultimately, application of MFA to more realistic tumor models will enable researchers to address new questions related to metabolic consequences of tumor development, tissue heterogeneity, stromal interactions and metastasis.
Conclusions
MID and MFA analyses provide an attractive platform for both local and system-wide characterization of intracellular metabolism. Through the application of these techniques, multiple metabolic enzymes have been identified that provide potential therapeutic targets for primary or adjuvant treatments in a range of cancers. However, it is becoming increasingly apparent that Otto Warburg’s monolithic view of cancer metabolism is no longer adequate to encompass the diversity of cancer phenotypes that have been reported. The differential effects of K-Ras, Myc, ER and Met signaling on cell metabolism highlight the growing need for molecular subtyping of tumors as a way to understand disease progression and predict drug response. Ultimately, information from MFA studies may allow us to pinpoint critical metabolic hubs that are vulnerable to treatment based upon the specific molecular alterations within a patient’s tumor.
Acknowledgment
This work was supported by NIH CA155964 and NSF CBET-1105991.
References
| 1. | Koppenol WH, Bounds PL, Dang CV. Otto Warburg’s contributions to current concepts of cancer metabolism. Nat Rev Cancer 2011;11:325-37.  [PUBMED] |
| 2. | Kim JW, Dang CV. Cancer’s molecular sweet tooth and the Warburg effect. Cancer Res 2006;66:8927-30. [PUBMED] |
| 3. | Fantin VR, St-Pierre J, Leder P. Attenuation of LDH-A expression uncovers a link between glycolysis, mitochondrial physiology, and tumor maintenance. Cancer Cell 2006;9:425-34. [PUBMED] |
| 4. | Le A, Cooper CR, Gouw AM, Dinavahi R, Maitra A, Deck LM, et al. Inhibition of lactate dehydrogenase A induces oxidative stress and inhibits tumor progression. Proc Natl Acad Sci U S A 2010;107:2037-42. [PUBMED] |
| 5. | Christofk HR, Vander Heiden MG, Harris MH, Ramanathan A, Gerszten RE, Wei R, et al. The M2 splice isoform of pyruvate kinase is important for cancer metabolism and tumour growth. Nature 2008;452:230-3. [PUBMED] |
| 6. | DeBerardinis RJ, Cheng T. Q’s next: The diverse functions of glutamine in metabolism, cell biology and cancer. Oncogene 2010;29:313-24. [PUBMED] |
| 7. | Possemato R, Marks KM, Shaul YD, Pacold ME, Kim D, Birsoy K, et al. Functional genomics reveal that the serine synthesis pathway is essential in breast cancer. Nature 2011;476:346-50. [PUBMED] |
| 8. | Locasale JW, Grassian AR, Melman T, Lyssiotis CA, Mattaini KR, Bass AJ, et al. Phosphoglycerate dehydrogenase diverts glycolytic flux and contributes to oncogenesis. Nat Genet 2011;43:869-74. [PUBMED] |
| 9. | Jain M, Nilsson R, Sharma S, Madhusudhan N, Kitami T, Souza AL, et al. Metabolite profiling identifies a key role for glycine in rapid cancer cell proliferation. Science 2012;336:1040-4. [PUBMED] |
| 10. | Reitman ZJ, Yan H. Isocitrate dehydrogenase 1 and 2 mutations in cancer: Alterations at a crossroads of cellular metabolism. J Natl Cancer Inst 2010;102:932-41. [PUBMED] |
| 11. | Dang L, Jin S, Su SM. IDH mutations in glioma and acute myeloid leukemia. Trends Mol Med 2010;16:387-97. [PUBMED] |
| 12. | Toro JR, Nickerson ML, Wei MH, Warren MB, Glenn GM, Turner ML, et al. Mutations in the fumarate hydratase gene cause hereditary leiomyomatosis and renal cell cancer in families in North America. Am J Hum Genet 2003;73:95-106. [PUBMED] |
| 13. | Astuti D, Latif F, Dallol A, Dahia PL, Douglas F, George E, et al. Gene mutations in the succinate dehydrogenase subunit SDHB cause susceptibility to familial pheochromocytoma and to familial paraganglioma. Am J Hum Genet 2001;69:49-54. [PUBMED] |
| 14. | Hanahan D, Weinberg RA. Hallmarks of cancer: The next generation. Cell 2011;144:646-74. [PUBMED] |
| 15. | Sauer U. Metabolic networks in motion: 13C-based flux analysis. Mol Syst Biol 2006;2:62. [PUBMED] |
| 16. | Niklas J, Heinzle E. Metabolic flux analysis in systems biology of mammalian cells. Adv Biochem Eng Biotechnol 2012;127:109-32. [PUBMED] |
| 17. | Gomes LC, Simões M. C metabolic flux analysis: From the principle to recent applications. Curr Bioinform 2012;7:77-86. |
| 18. | Winter G, Krömer JO. Fluxomics-connecting ‘omics analysis and phenotypes. Environ Microbiol 2013;doi:10.1111/1462-2920.12064. |
| 19. | Quek LE, Dietmair S, Krömer JO, Nielsen LK. Metabolic flux analysis in mammalian cell culture. Metab Eng 2010;12:161-71. |
| 20. | Zamboni N, Fendt SM, Rühl M, Sauer U.(13) C-based metabolic flux analysis. Nat Protoc 2009;4:878-92. |
| 21. | Zamboni N. 13C metabolic flux analysis in complex systems. Curr Opin Biotechnol 2011;22:103-8. [PUBMED] |
| 22. | Roche TE, Hiromasa Y. Pyruvate dehydrogenase kinase regulatory mechanisms and inhibition in treating diabetes, heart ischemia, and cancer. Cell Mol Life Sci 2007;64:830-49. [PUBMED] |
| 23. | Kim JW, Tchernyshyov I, Semenza GL, Dang CV. HIF-1-mediated expression of pyruvate dehydrogenase kinase: A metabolic switch required for cellular adaptation to hypoxia. Cell Metab 2006;3:177-85. [PUBMED] |
| 24. | Mazurek S, Boschek CB, Hugo F, Eigenbrodt E. Pyruvate kinase type M2 and its role in tumor growth and spreading. Semin Cancer Biol 2005;15:300-8. [PUBMED] |
| 25. | Luo W, Hu H, Chang R, Zhong J, Knabel M, O’Meally R, et al. Pyruvate kinase M2 is a PHD3-stimulated coactivator for hypoxia-inducible factor 1. Cell 2011;145:732-44. [PUBMED] |
| 26. | Wu S, Le H. Dual roles of PKM2 in cancer metabolism. Acta Biochim Biophys Sin (Shanghai) 2013;45:27-35. [PUBMED] |
| 27. | Ye J, Mancuso A, Tong X, Ward PS, Fan J, Rabinowitz JD, et al. Pyruvate kinase M2 promotes de novo serine synthesis to sustain mTORC1 activity and cell proliferation. Proc Natl Acad Sci U S A 2012;109:6904-9. [PUBMED] |
| 28. | Grassian AR, Metallo CM, Coloff JL, Stephanopoulos G, Brugge JS. Erk regulation of pyruvate dehydrogenase flux through PDK4 modulates cell proliferation. Genes Dev 2011;25:1716-33. [PUBMED] |
| 29. | Wise DR, Thompson CB. Glutamine addiction: A new therapeutic target in cancer. Trends Biochem Sci 2010;35:427-33. [PUBMED] |
| 30. | DeBerardinis RJ, Mancuso A, Daikhin E, Nissim I, Yudkoff M, Wehrli S, et al. Beyond aerobic glycolysis: Transformed cells can engage in glutamine metabolism that exceeds the requirement for protein and nucleotide synthesis. Proc Natl Acad Sci U S A 2007;104:19345-50. [PUBMED] |
| 31. | Metallo CM, Walther JL, Stephanopoulos G. Evaluation of 13C isotopic tracers for metabolic flux analysis in mammalian cells. J Biotechnol 2009;144:167-74. [PUBMED] |
| 32. | Metallo CM, Gameiro PA, Bell EL, Mattaini KR, Yang J, Hiller K, et al. Reductive glutamine metabolism by IDH1 mediates lipogenesis under hypoxia. Nature 2011;481:380-4. [PUBMED] |
| 33. | Scott DA, Richardson AD, Filipp FV, Knutzen CA, Chiang GG, Ronai ZA, et al. Comparative metabolic flux profiling of melanoma cell lines: Beyond the Warburg effect. J Biol Chem 2011;286:42626-34. [PUBMED] |
| 34. | Wise DR, Ward PS, Shay JE, Cross JR, Gruber JJ, Sachdeva UM, et al. Hypoxia promotes isocitrate dehydrogenase-dependent carboxylation of α-ketoglutarate to citrate to support cell growth and viability. Proc Natl Acad Sci U S A 2011;108:19611-6. [PUBMED] |
| 35. | Mullarky E, Mattaini KR, Vander Heiden MG, Cantley LC, Locasale JW. PHGDH amplification and altered glucose metabolism in human melanoma. Pigment Cell Melanoma Res 2011;24:1112-5. [PUBMED] |
| 36. | Pollari S, Käkönen SM, Edgren H, Wolf M, Kohonen P, Sara H, et al. Enhanced serine production by bone metastatic breast cancer cells stimulates osteoclastogenesis. Breast Cancer Res Treat 2011;125:421-30. |
| 37. | Bos JL. Ras oncogenes in human cancer: A review. Cancer Res 1989;49:4682-9. [PUBMED] |
| 38. | Bossù P, Vanoni M, Wanke V, Cesaroni MP, Tropea F, Melillo G, et al. A dominant negative RAS-specific guanine nucleotide exchange factor reverses neoplastic phenotype in K-ras transformed mouse fibroblasts. Oncogene 2000;19:2147-54. |
| 39. | Ying H, Kimmelman AC, Lyssiotis CA, Hua S, Chu GC, Fletcher-Sananikone E, et al. Oncogenic Kras maintains pancreatic tumors through regulation of anabolic glucose metabolism. Cell 2012;149:656-70. [PUBMED] |
| 40. | Gaglio D, Metallo CM, Gameiro PA, Hiller K, Danna LS, Balestrieri C, et al. Oncogenic K-Ras decouples glucose and glutamine metabolism to support cancer cell growth. Mol Syst Biol 2011;7:523. [PUBMED] |
| 41. | Son J, Lyssiotis CA, Ying H, Wang X, Hua S, Ligorio M, et al. Glutamine supports pancreatic cancer growth through a KRAS-regulated metabolic pathway. Nature 2013;496:101-5. [PUBMED] |
| 42. | Murphy TA, Dang CV, Young JD. Isotopically nonstationary 13C flux analysis of Myc-induced metabolic reprogramming in B-cells. Metab Eng 2013;15:206-17. [PUBMED] |
| 43. | Le A, Lane AN, Hamaker M, Bose S, Gouw A, Barbi J, et al. Glucose-independent glutamine metabolism via TCA cycling for proliferation and survival in B cells. Cell Metab 2012;15:110-21. |
| 44. | Forbes NS, Meadows AL, Clark DS, Blanch HW. Estradiol stimulates the biosynthetic pathways of breast cancer cells: Detection by metabolic flux analysis. Metab Eng 2006;8:639-52. [PUBMED] |
| 45. | Weitzel M, Nöh K, Dalman T, Niedenführ S, Stute B, Wiechert W. 13CFLUX2: High-performance software suite for (13) C-metabolic flux analysis. Bioinformatics 2013;29:143-5. |
| 46. | Quek LE, Wittmann C, Nielsen LK, Krömer JO. Open FLUX: Efficient modelling software for 13C-based metabolic flux analysis. Microb Cell Fact 2009;8:25. |
| 47. | Srour O, Young JD, Eldar YC. Fluxomers: A new approach for 13C metabolic flux analysis. BMC Syst Biol 2011;5:129. [PUBMED] |
| 48. | Murphy TA, Young JD. ETA: Robust software for determination of cell specific rates from extracellular time courses. Biotechnol Bioeng 2013;110:1748-58. [PUBMED] |
| 49. | Kim BJ, Forbes NS. Flux analysis shows that hypoxia-inducible-factor-1-alpha minimally affects intracellular metabolism in tumor spheroids. Biotechnol Bioeng 2007;96:1167-82. [PUBMED] |
| 50. | Yuneva MO, Fan TW, Allen TD, Higashi RM, Ferraris DV, Tsukamoto T, et al. The metabolic profile of tumors depends on both the responsible genetic lesion and tissue type. Cell Metab 2012;15:157-70. |
| 51. | Marin-Valencia I, Yang C, Mashimo T, Cho S, Baek H, Yang XL, et al. Analysis of tumor metabolism reveals mitochondrial glucose oxidation in genetically diverse human glioblastomas in the mouse brain in vivo. Cell Metab 2012;15:827-37. [PUBMED] |
Authors
Mr. Casey Scott Duckwall: Department of Chemical and Biomolecular Engineering, PMB 351604, 2301 Vanderbilt Place, Vanderbilt University, Nashville, TN 37235-1604, USA.
Dr. Taylor Athanasaw Murphy: Department of Chemical and Biomolecular Engineering, PMB 351604, 2301 Vanderbilt Place, Vanderbilt University, Nashville, TN 37235-1604, USA.
Dr. Jamey Dale Young: Department of Chemical and Biomolecular Engineering and Department of Molecular Physiology and Biophysics, PMB 351604, 2301 Vanderbilt Place, Vanderbilt University, Nashville, TN 37235-1604, USA.